Results of Operations Highlight

Sales, profit and loss
(¥ million)
| |
2021/11 |
2022/11 |
2023/11 |
2024/11 |
2025/11 |
| |
Results |
Results |
Results |
Results |
Results |
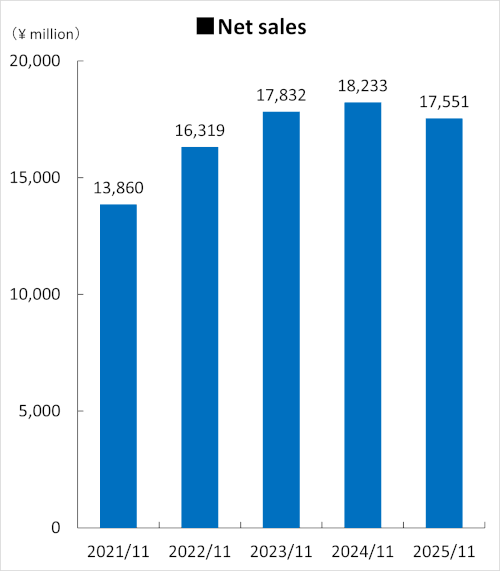
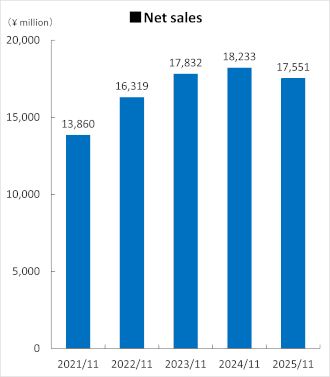
| Net Sales |
13,860 |
16,319 |
17,832 |
18,233 |
17,551 |
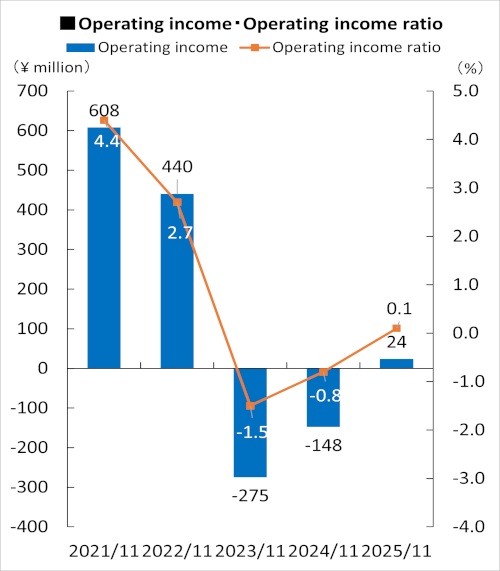
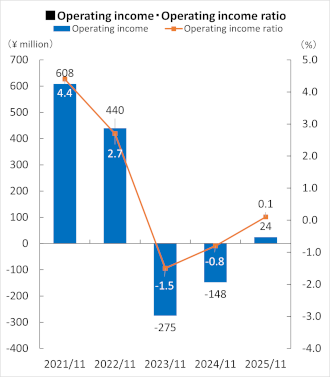
| Operating income (loss) |
608 |
440 |
-275 |
-148 |
24 |
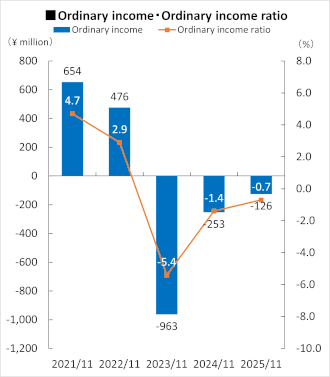
| Ordinary income (loss) |
654 |
476 |
-963 |
-253 |
-126 |
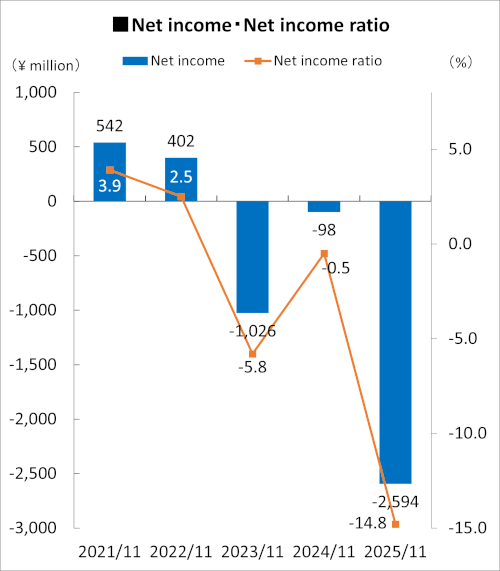
| Net income (loss) |
542 |
402 |
-1,026 |
-98 |
-2,594 |
Profitability Indicators
(%, pt)
| |
2021/11 |
2022/11 |
2023/11 |
2024/11 |
2025/11 |
| Operating income ratio |
4.4% |
2.7% |
-1.5% |
-0.8% |
0.1% |
| Ordinary income ratio |
4.7% |
2.9% |
-5.4% |
-1.4% |
-0.7% |
| Net income ratio |
3.9% |
2.5% |
-5.8% |
-0.5% |
-14.8% |